Wix Analytics: About the Highlights Page
読了目安: 5分
The Wix Analytics Highlights page gives you a complete overview of your site's activity across all areas. The Highlights page gathers information from both analytics reports and overviews into one convenient and centralized hub to help you make informed business decisions.
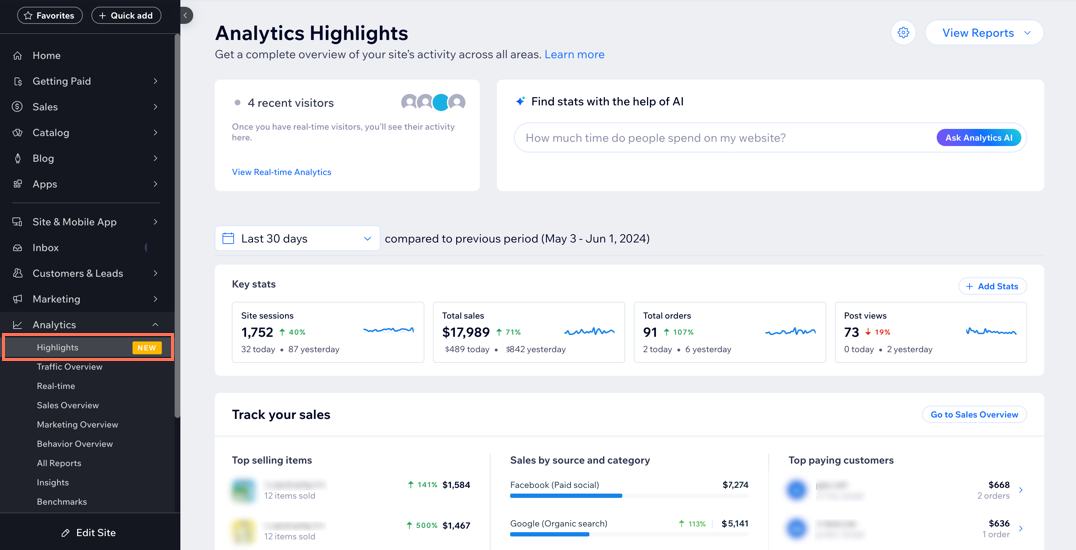
You can find the Analytics Highlights page under Analytics in your site's dashboard.
View your Analytics Highlights.
View information about real-time visitors on your site and how they're engaging, find stats with the help of AI, and get a snapshot of your site's overall traffic, behavior, marketing, and sales efforts. If you want to see a more in-depth breakdown of a specific metric, click either Go to X Overview at the top right of a section or View Report beneath a statistic.
ヒント
Click the View Reports drop-down at the top right of the Highlights page to see a full list of your recently viewed or saved reports. The recommended reports provided are personalized based on your site's actual data and activity.
Watch site visitors in real-time and chat with Analytics AI
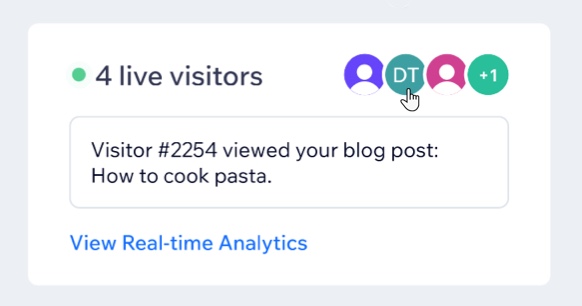
The top of the Highlights page gives you a glimpse of who is currently live on your site. Real-time visitor data is pulled from live activity in the past 5 minutes. If no live visitors are on your site, you'll see data from the last 30 minutes. Hover over a real-time visitor to see more detailed info about their current session. Learn more about real-time analytics.
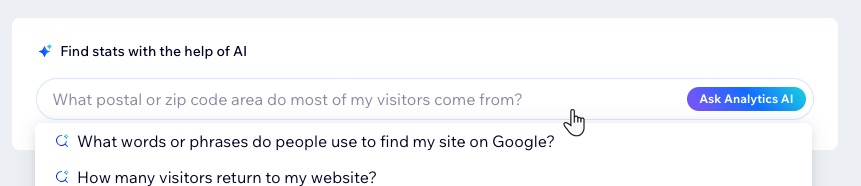
You can also engage with the Analytics AI Assistant at the top of the Highlights page. Get answers to data related questions about your site, such as the number of site visits, top pages viewed, and more. To get ideas of what to ask the Analytics AI Assistant, click the text box to open a list of preset questions. You can also free type a question in the textbox.
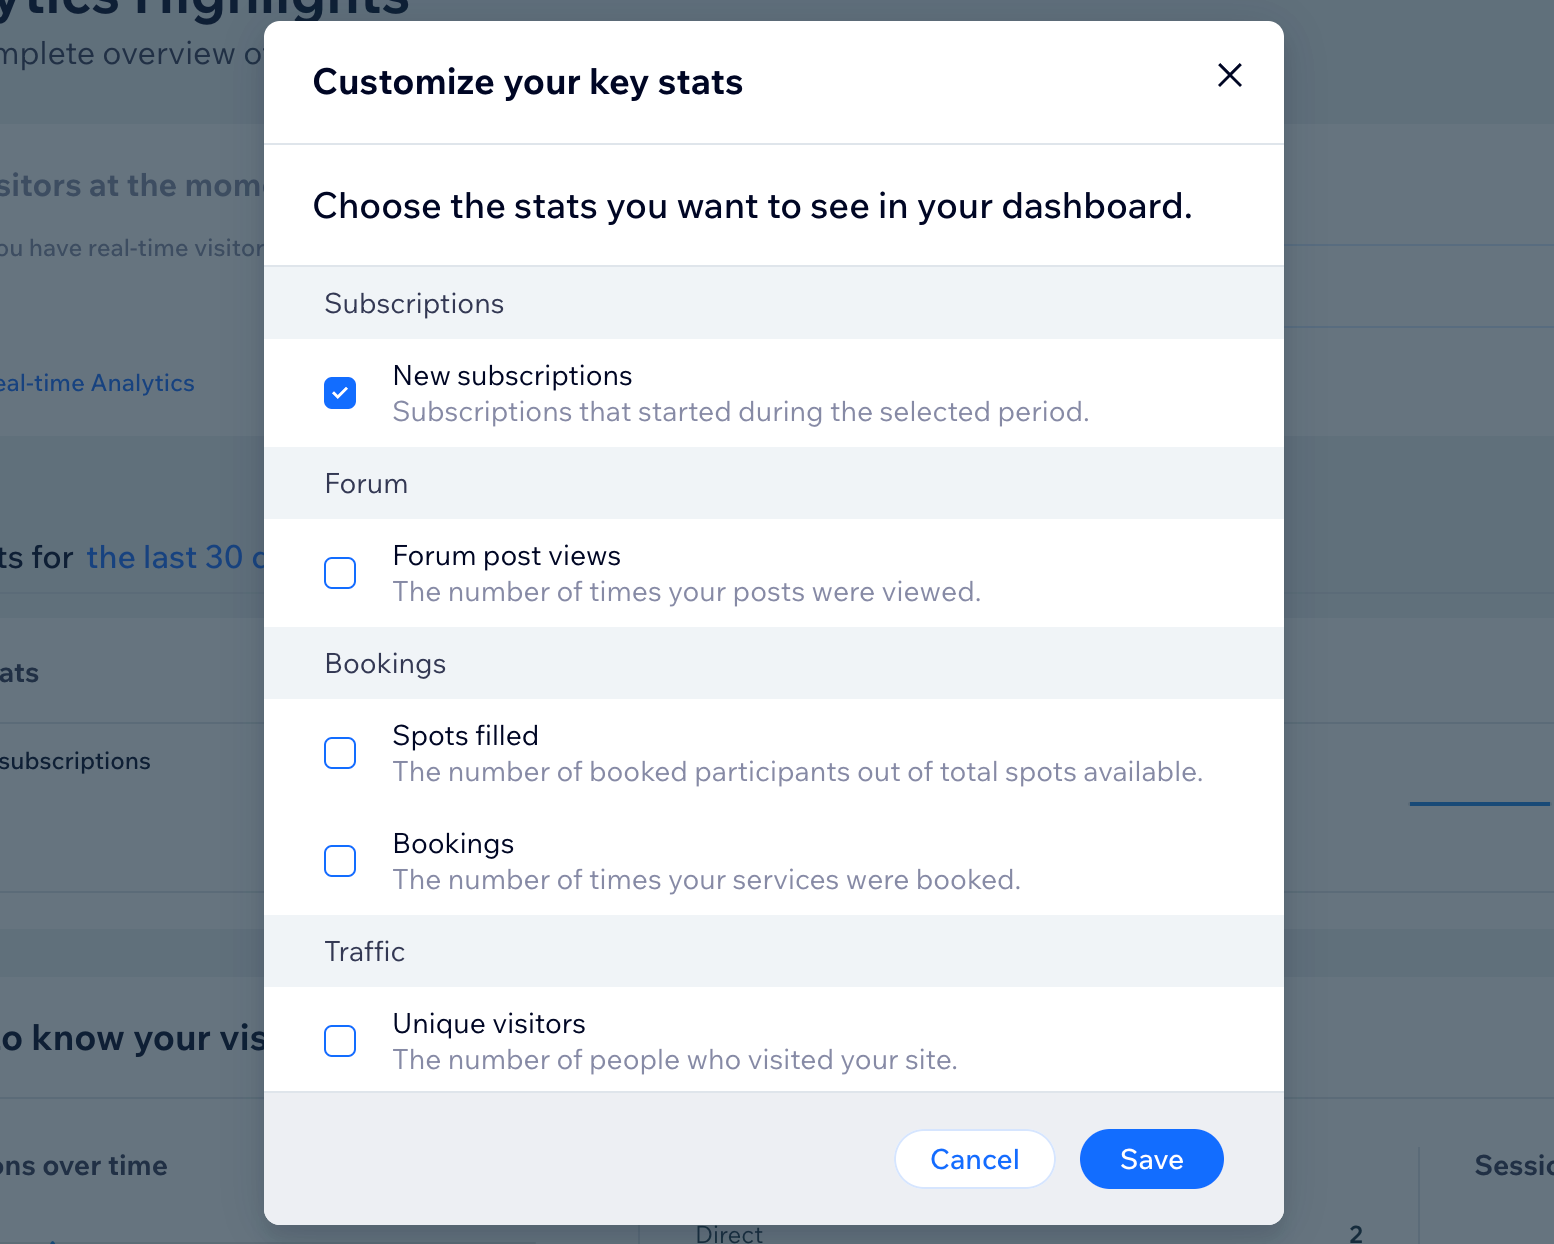
Analyze key site statistics and customize your view
The key stats section pulls the most important statistics from across your site and shows you highlights from the last 30 days. Click Last 30 days drop-down to adjust the timeframe.
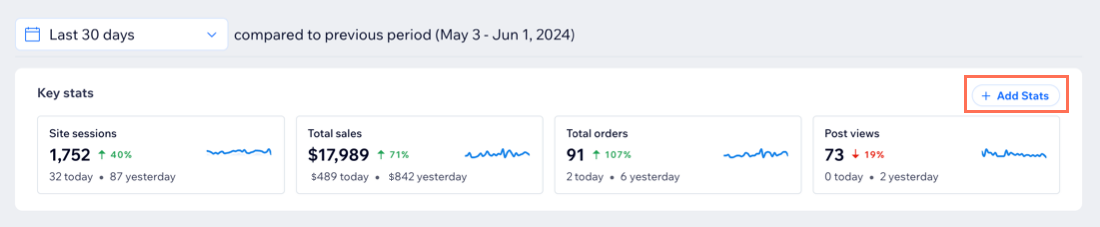
You can also customize what appears in the key stats section. Click +Add Stats at the top right to add more metrics to this panel or remove irrelevant metrics. For example, if you sell subscriptions on your site you can choose to view new subscriptions.
These key stats are also shown on your dashboard's Home page; any changes made will reflect in both places.
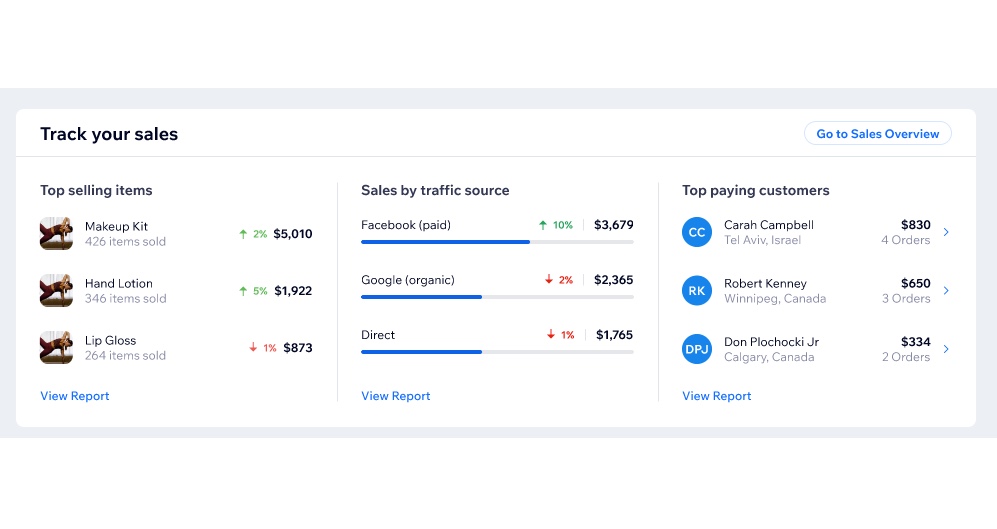
Track your sales and view top sales reports
If you are selling something on your site (e.g. products, services, subscriptions) the next section of the Highlights page offers a preview of the Sales Overview. View top selling items or services, track sales by traffic source, and get a snapshot of your top paying customers.
Click Go to Sales Overview at the top right of the section to see a full breakdown of your site's sales and transaction information. Learn more about the Sales Overview.
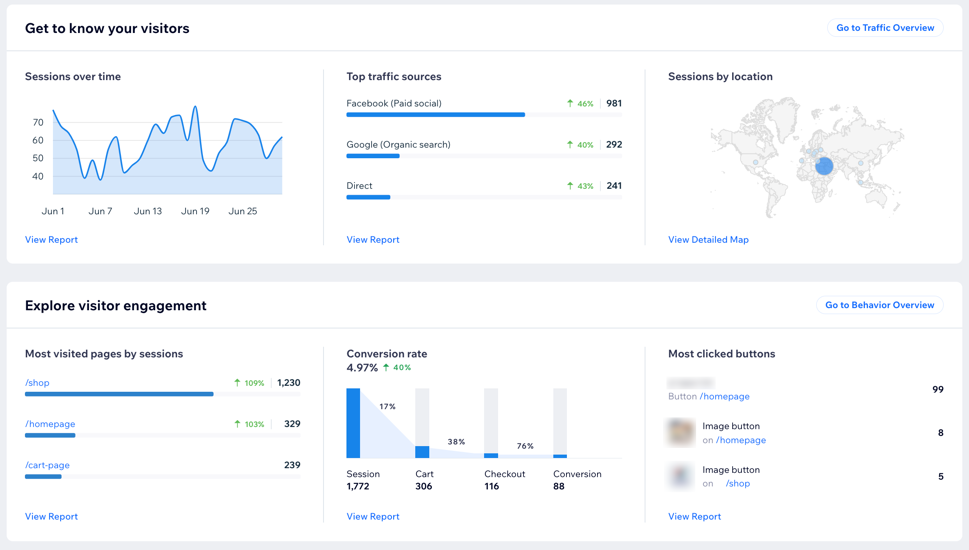
Get to know site visitor behavior and traffic trends
The next two sections of the Highlights page allow you to dig deeper into site visitor statistics as well as what actions they perform on your site's pages.
Get a quick overview of your site's traffic with sessions over time, top traffic sources, as well as sessions by location. Learn more about the Traffic Overview.
You can also see highlights of visitor behavior on your site, including top visited site pages, engagement statistics like average session duration, or your conversion funnel. Use stats such as 'Most clicked buttons' to prioritize where to place important info on your site. Learn more about the Behavior Overview.
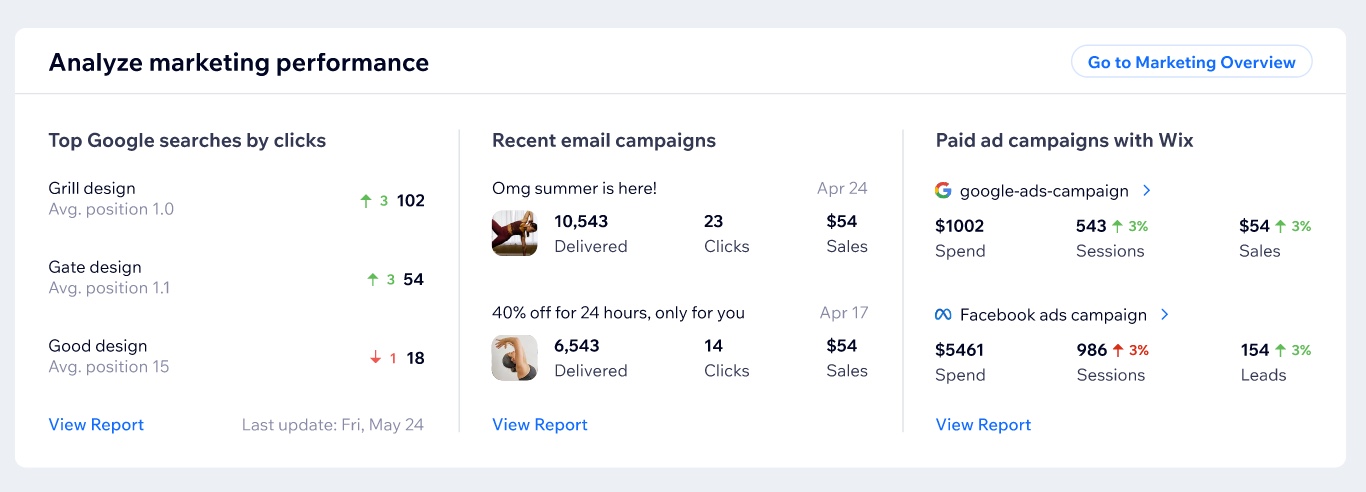
View your marketing performance highlights
The Highlights page also offers a preview of the Marketing Overview. If your site is connected to Google Search Console, you can see information about Top Google searches by clicks.
If you are running marketing efforts on your site, you can get highlights of your recent email campaigns and paid ad campaigns that were created with Wix. Learn more about the Marketing Overview.
注釈
- The Highlights page shows marketing data from the last 30 days, including today. If you go to the full Marketing Overview you will see data from the past 30 days up to yesterday.
- The Highlights page shows real-time data whereas other pages (such as Analytics Reports or Behavior Overview) have a 1-hour delay. This may cause minor discrepancies in the data presented.
- Wix Analytics does not track site visitors who have not provided consent to data collection.
これは役に立ったか?
|